Re-writing history again.

WhatsHisNuts

Woke
Forum Member
Aug 29, 2006
27,490
958
113
49
Earth
www.ffrf.org
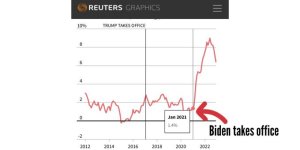
That fiscally responsible administration right before Biden only added 7 Trillion to the debt. I believe that's the same party that left office right before inflation started to take off and blamed it all on government spending.
 

WhatsHisNuts

Woke
Forum Member
Aug 29, 2006
27,490
958
113
49
Earth
www.ffrf.org

The Post Millennial

@TPostMillennial
?
Follow

Reporter: "Do you take any blame for inflation, Mr. president?" Biden: "No" Reporter: "Why not?" Biden: "It was already there when I got here, man"

<iframe src='https://d3fy651gv2fhd3.cloudfront.net/embed/?s=ukrpcjyr&v=202301180739V20220312&d1=20130206&h=300&w=600' height='300' width='600' frameborder='0' scrolling='no'></iframe><br />source: <a href='https://tradingeconomics.com/united-kingdom/inflation-cpi'>tradingeconomics.com</a>

UK inflation rate during the same period
 

DOGS THAT BARK

Registered User
Forum Member
Jul 13, 1999
19,426
128
63
Bowling Green Ky
I can't wait for the thoughtful responses to the comparison of the two graphs.

Let me try
I instead of your "pick and choose" liberal scheme...How about US vs all countries a much truer reflection.
https://tradingeconomics.com/country-list/inflation-rate

Ya know Gary, as one I consider a friend. I still trying to decide whether you are just a liberal radical with intent..or just a sheep of the "cause" who who doesn't know any better!
I have hoped for the latter....but your a smart successful individual...you should know better...so I wonder????

China1.81.6Dec/22%
Switzerland2.83Dec/22%
Saudi Arabia3.32.9Dec/22%
Japan43.8Dec/22%
South Korea5.25Jan/23%
Indonesia5.285.51Jan/23%
India5.725.88Dec/22%
Brazil5.795.9Dec/22%
Spain5.85.7Jan/23%
France65.9Jan/23%
Canada6.36.8Dec/22%
Singapore6.56.7Dec/22%
United States6.57.1Dec/22%
 

WhatsHisNuts

Woke
Forum Member
Aug 29, 2006
27,490
958
113
49
Earth
www.ffrf.org
Here's the EU combined.

<iframe src='https://d3fy651gv2fhd3.cloudfront.net/embed/?s=eccpemuy&v=202302011017V20220312&d1=20130207&h=300&w=600' height='300' width='600' frameborder='0' scrolling='no'></iframe><br />source: <a href='https://tradingeconomics.com/euro-area/inflation-cpi'>tradingeconomics.com</a>

Annual inflation rate in the Euro Area fell to an eight-month low of 8.5% in January of 2023 from 9.2% in December, below forecasts of 9%, preliminary estimates showed. The data for Germany inflation is not available though, as the country's statistical office had to delay the release of its own figures due to technical issues with data processing. Inflation slowed in Italy, Ireland and the Netherlands, but edged higher in Spain and France. Also, core inflation which excludes prices of energy, food, alcohol and tobacco remained steady at 5.2%, adding to further evidence that price pressures remained elevated in the bloc's economy. In January, energy prices rose at a slower pace (17.2% vs 25.5%) and services inflation also eased (4.2% vs 4.4%) while cost increased faster for food, alcohol & tobacco (14.1% vs 13.8%) and non-energy industrial goods (6.9% vs 6.4%). Compared to the previous month, consumer prices fell 0.4%, the same as in December, led by a 0.9% decline in energy cost. source: EUROSTAT

Not buying into the radical right wing talking points doesn't make me the radical.

Here's Canada. Notice how the graph follows the trajectory of all the rest.

<iframe src='https://d3fy651gv2fhd3.cloudfront.net/embed/?s=cacpiyoy&v=202301171355V20220312&d1=20130207&h=300&w=600' height='300' width='600' frameborder='0' scrolling='no'></iframe><br />source: <a href='https://tradingeconomics.com/canada/inflation-cpi'>tradingeconomics.com</a>

Here's Brazil.
<iframe src='https://d3fy651gv2fhd3.cloudfront.net/embed/?s=bzpiipcy&v=202301101221V20220312&d1=20130207&h=300&w=600' height='300' width='600' frameborder='0' scrolling='no'></iframe><br />source: <a href='https://tradingeconomics.com/brazil/inflation-cpi'>tradingeconomics.com</a>

Here's Japan. The numbers aren't as high but that graph sure looks familiar
<iframe src='https://d3fy651gv2fhd3.cloudfront.net/embed/?s=jncpiyoy&v=202301200851V20220312&d1=20130207&h=300&w=600' height='300' width='600' frameborder='0' scrolling='no'></iframe><br />source: <a href='https://tradingeconomics.com/japan/inflation-cpi'>tradingeconomics.com</a>

Here's South Korea
<iframe src='https://d3fy651gv2fhd3.cloudfront.net/embed/?s=kocpiyoy&v=202302012330V20220312&d1=20130207&h=300&w=600' height='300' width='600' frameborder='0' scrolling='no'></iframe><br />source: <a href='https://tradingeconomics.com/south-korea/inflation-cpi'>tradingeconomics.com</a>

If you're calling me out for cherry picking info, I think it looks like it's the other way around, no?

I didn't check out the middle east or communist countries but if you think that makes your case, go for it.
 

WhatsHisNuts

Woke
Forum Member
Aug 29, 2006
27,490
958
113
49
Earth
www.ffrf.org
I seriously hope you respond, Wayne. The data supports what I have been saying all along. This is a WORLDWIDE issue. Biden and his policies aren't the issue. I doubt you'll ever admit it, despite the facts being pasted right before you, but it's clearly the truth. You can eat up the talking points of the right wing media all you like but the facts aren't on your side.
 

WhatsHisNuts

Woke
Forum Member
Aug 29, 2006
27,490
958
113
49
Earth
www.ffrf.org
The fact is Biden lies about it.

Lies about what? The right wing media and politicians are all pushing the same narrative: Inflation is Biden and the democrats fault. The graphs above prove it's a global phenomenon. The claims of Biden's reckless spending from the party that increased the national debt by 1/3 is a complete joke. If this information was being kept from you and you bought the narrative, that's fine. But to see the proof and still buy the same bullshit makes you look like a fool.
 

DOGS THAT BARK

Registered User
Forum Member
Jul 13, 1999
19,426
128
63
Bowling Green Ky
A pic is worth a thousand words.
Energy is # 1 factor on inflation. When you go from fuel surplus and full reserves To lowest reserves in decades. There has to be reason Considering time line is perfect match to Bidens assault on energy would lead most to think it was not coincidence. Europes inflation started later as result of Russia cutting supplies.


https://data.bls.gov/timeseries/CUUR0000SA0L1E?output_view=pct_12mths

latest_numbers_CUUR0000SA0L1E_2012_2022_all_period_M12_pct_12mths.gif
 

WhatsHisNuts

Woke
Forum Member
Aug 29, 2006
27,490
958
113
49
Earth
www.ffrf.org
A pic is worth a thousand words.
Energy is # 1 factor on inflation. When you go from fuel surplus and full reserves To lowest reserves in decades. There has to be reason Considering time line is perfect match to Bidens assault on energy would lead most to think it was not coincidence. Europes inflation started later as result of Russia cutting supplies.


https://data.bls.gov/timeseries/CUUR0000SA0L1E?output_view=pct_12mths

latest_numbers_CUUR0000SA0L1E_2012_2022_all_period_M12_pct_12mths.gif

I thought reckless government spending was the reason? Now it's "Bidens assault on energy" and it's just a complete coincidence that the rest of the world's graph matches ours.....because of Russia. You're working way too hard. The reserves got depleted well after the invasion and our inflation rates are receding (which doesn't match the graph). Remember the last time you tried telling us that Trump got us energy independent and I proved not only how that was ridiculous but that under Biden, the US was producing more oil than at nearly any other point in history?
 
Bet on MyBookie
Top