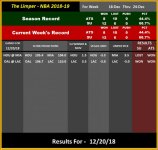
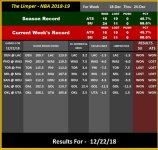
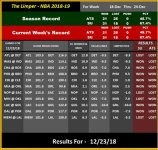
The projections listed below are based on this season?s team and player data, and, as a rule, at least 40 games worth of data is required to make the numbers reliable. However, I?ve been running the model since December 1st, and it?s doing well enough to start posting a bit early ? so here it is.
The point of the calculations in my model, is the Margin of Victory (MOV), and not the projected scores. Put another way, the posted scores are, for the most part, based on the projected MOV ? and not the other way around, which makes the scores a bit unreliable for over/under totals. That said, the scores don?t come out thin air, and I use them myself in my O/U wagering.
I?ll be posting daily as early as I can, but I?m a one man band in the middle of the Pacific Ocean, so ? right now I?m 5 hours behind EST. This means, at best, I?ll be posting 4-5 hours before the earliest day?s tip-offs.
I usually run the model until a couple weeks after the All Star break, which is when it starts to break down, as teams going nowhere start to tank, and playoff bound teams begin sitting or resting starters, making past performance data more and more irrelevant/and or unreliable. I restart things come the playoffs.
ATS records are based on the Vegas Insider closing lines, which often change, and ? although the posted MOV doesn?t change ? the model does a periodic sweep of those closing lines, which can have the effect of flipping picks (behind the back), and the ATS Season record could go up or down depending on what it finds.
For example: Toronto playing Portland has a projected MOV of TOR 5.8, and with an initial line of TOR -6, the pick would be POR +6, which how it will be posted. And, if Toronto wins by 4, it will initially go down as an ATS loss. However, if ten minutes before tip-off, Lillard gets sick and won?t play, and the line drops to TOR -3 and closes there, when the closing line sweep is made, because the MOV is still TOR 5.8, the pick flips to TOR -3, and a loss turns into a win. The reverse happens as well, about as often.
I use VI?s closing lines as they are a public and reliable way to grade the model ? and I have to use something.
This model produces ?projections?, and not ?predictions? ? which, after all, is the job of the bettor. Use of statistical projections is a smart guide to making predictions, but only a guide. If you follow a sport, and use the numbers to guide your selection, you?ll be using this model correctly.
GLTA.
Ps. Depending on the posting editing options of this web site, you may need to scroll down to the end of the thread to get the most recent day?s projections and results. I?ll post the daily projections for the week as well as the day?s results within each new weekly thread.


